How to Read Aquarium PAR Charts
Modern aquarium lights often come with detailed PAR charts, but many aquarists still struggle to interpret them correctly. Numbers, grids, and heat maps can look technical at first, yet they contain some of the most useful information for planted tank design. When you know how to read them, PAR charts help you understand where strong plant growth is possible, where weak light zones exist, and whether a fixture actually suits your aquarium dimensions.
This lesson focuses specifically on how to read aquarium PAR charts. Instead of covering aquarium lighting in general, it explains how to interpret light distribution, substrate intensity, edge drop-off, and real-world tank conditions. If you want a broader overview of lighting systems, fixtures, and plant demand, see our Aquarium Lighting Guide.
Once you understand PAR charts, you can use them as a practical planning tool — not just as a manufacturer graphic. That means better plant placement, more realistic expectations, and fewer lighting mistakes in both low-tech and high-tech aquariums.
What you’ll learn in this lesson
- What aquarium PAR charts actually measure
- How to interpret chart axes, grids, and heat maps
- How PAR changes with depth, spread, and tank conditions
- How to use PAR charts for plant placement and aquascape planning
- Which mistakes to avoid when comparing manufacturer charts
What Aquarium PAR Charts Actually Show
Aquarium PAR charts show how much photosynthetically active radiation reaches different parts of the tank. In simple terms, they show how much usable light is available for plant growth at specific positions. Unlike wattage or lumen claims, PAR is focused on plant-relevant light rather than electricity use or human brightness perception.
PAR is usually measured in µmol/m²/s. That unit may sound technical, but in practice it simply describes how much plant-usable light lands on a given surface area each second. Higher values mean stronger light intensity and greater growth potential — but also higher demand for system stability.
This is why PAR charts matter so much in planted tanks. They do not just tell you whether a light is “strong.” They show where that strength exists: directly under the fixture, near the substrate, or only at the center while the edges remain weak.
Why lumens and watts are not enough
Many beginners compare aquarium lights by wattage or lumens, but those values can be misleading. Watts only tell you how much electricity a fixture consumes. Lumens describe brightness as perceived by the human eye. Neither value tells you how much usable light actually reaches aquarium plants at depth.
PAR charts are far more practical because they show real light distribution inside the aquarium. That makes them one of the best tools for comparing fixtures, especially when choosing lights for carpets, red stem plants, or deeper tanks.
If you want to estimate realistic PAR targets before buying a new light, the Aquarium Lighting Calculator can help you compare tank dimensions, plant demand, and target intensity more effectively.
The Anatomy of an Aquarium PAR Chart
Most aquarium PAR charts use one of three formats: a numerical grid, a heat map, or a depth-based measurement chart. All three attempt to visualize the same thing: how light spreads through aquarium space.
Chart axes explained
In most grid-based charts, the horizontal axis represents the spread of light from left to right across the tank, while the vertical dimension represents depth from the fixture down toward the substrate. Each measured point shows a PAR value at a specific location.
That means a PAR chart is not a single performance number. It is a map of how light behaves inside a three-dimensional aquarium environment. This is important because two fixtures can have similar maximum output but very different spread patterns.
PAR heat maps
Heat maps use colors to visualize intensity zones. Warmer colors usually indicate stronger PAR, while cooler colors indicate weaker light. These charts are easy to read visually, but they can sometimes hide important detail if exact numbers are not shown clearly.
A heat map is useful for spotting hotspots and weak corners quickly. If a fixture shows a bright center but cool-colored edges, it may have strong peak output but poor side coverage.
Depth measurement charts
Some manufacturers show PAR values only at different depths. These charts can be useful, but they often leave out horizontal spread. A light may look excellent on a depth chart while still producing disappointing edge coverage in a real aquarium.
Whenever possible, it is best to use a chart that includes both depth and spread. That gives a much more realistic picture of how the light will behave in an aquascape.
How PAR Changes Inside an Aquarium
One of the biggest mistakes beginners make is assuming PAR is uniform across the entire tank. In reality, light changes constantly depending on distance, water depth, surface movement, and physical obstructions.
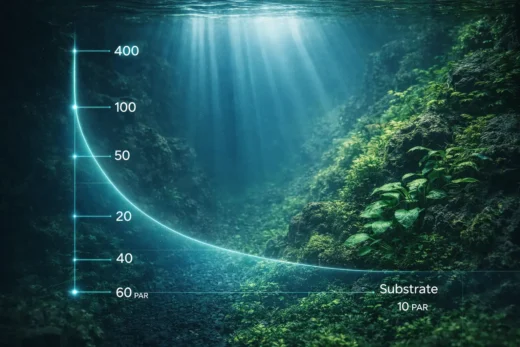
Distance from the light
The farther light travels from the source, the weaker it becomes. This means PAR is always highest near the fixture and lower at the substrate. In shallow tanks the loss may be manageable, but in tall aquariums the drop can be significant.
Tank depth
Depth has a direct impact on how much PAR reaches rooted plants. A fixture that works well on a 35 cm deep tank may be too weak for a 55 cm deep aquarium. This is why tall tanks often need stronger fixtures, better reflectors, multiple lights, or more careful plant selection.
Water clarity
Clear water allows better light penetration. Tannins, algae film, suspended particles, and dirty covers all reduce PAR. Manufacturer charts often assume ideal test conditions, which means real aquariums may perform worse than the published data suggests.
Surface movement
Surface agitation improves gas exchange, but it can also create reflection and diffusion at the water surface. In most tanks the effect is not huge, yet it still contributes to real-world PAR loss compared to perfectly controlled test setups.
| Factor | Effect on PAR | Why it matters |
|---|---|---|
| Greater depth | Reduces PAR at substrate | Important for carpets and rooted plants |
| Dirty water or tannins | Absorbs usable light | Published charts may overestimate real results |
| Strong surface movement | Slight reflection and diffusion | Can reduce penetration slightly |
| Mounting light higher | Often improves spread but lowers peak PAR | Useful when center hotspots are too strong |
Understanding PAR Levels for Aquarium Plants
Most aquascapers use PAR ranges as practical categories rather than absolute rules. These ranges are most helpful when measured at the substrate, because that is where many rooted aquarium plants live.
| Light Level | PAR Range | Example Plants |
|---|---|---|
| Low | 10–30 | Anubias, Java Fern, many mosses |
| Medium | 30–60 | Many stem plants, Cryptocoryne, easier rosette plants |
| High | 60+ | Carpeting plants, demanding stems, many red plants |
These categories help translate charts into plant decisions. If you want broader plant placement guidance by growth zone, see the Aquarium Plants Guide.
It is also important not to view high PAR as automatically better. Strong light increases demand for CO₂ stability, nutrients, circulation, and maintenance discipline. High PAR in an unstable aquarium often creates algae pressure rather than better plant growth.
Step-by-Step: How to Read a PAR Chart
The easiest way to interpret a PAR chart is to follow the same reading process every time. This prevents you from focusing only on peak numbers while missing the more important pattern of light distribution.
Step 1 – Find substrate PAR
Start by looking at the values closest to the substrate. This is the most important area for many planted tanks, especially if you plan to grow carpets or compact foreground plants. If substrate PAR is too low, a light may look powerful on paper but still be disappointing in practice.
Step 2 – Identify center intensity
The center of the tank is usually the brightest zone. Note how strong this hotspot is. A very intense center with poor edge values often means the fixture is focused more on peak output than balanced coverage.
Step 3 – Check edge drop-off
Now compare the center with the outer zones. If PAR falls sharply near the glass, you may need to reserve those areas for shade-tolerant species or use multiple fixtures to improve coverage.
Step 4 – Evaluate spread coverage
Look at the overall map. Does the light create an even field, or does it form a narrow hotspot? A balanced spread is often more useful in aquascaping than an extremely high central reading.
Step 5 – Compare the map with plant requirements
Once you know the pattern, match plant types to the PAR zones. This is where a chart becomes practical. Instead of asking whether a light is “good,” you ask where each plant type will perform best inside the aquarium.
| Tank Area | Typical PAR | Best Use |
|---|---|---|
| Center foreground | 60–80 | Carpeting plants |
| Mid tank | 35–60 | Stem plants and compact rosettes |
| Shaded edge zones | 15–30 | Epiphytes and low-light species |
Real Example: Reading a PAR Chart Correctly
Imagine a 60 cm planted aquarium with the LED mounted 20 cm above the tank. The published chart shows the following approximate values:
| Position | PAR |
|---|---|
| Center substrate | 65 |
| Mid substrate | 45 |
| Edge substrate | 25 |
This chart immediately tells you that the fixture can support a demanding foreground in the center, moderate growth in the mid zones, and lower-light plants near the sides. That is much more useful than simply knowing that the light reaches “high PAR.”
It also reveals that the tank may not be ideal for carpeting plants all the way from glass to glass unless a second fixture is added or the layout is adjusted strategically.
How Aquascapers Use PAR Charts for Layout Design
This is one of the most overlooked uses of PAR charts. They are not just for choosing lights — they are also for planning layouts.
Aquascapers can use PAR zones to decide where demanding plants should go and where lower-energy species make more sense. A smart layout does not fight the light map. It works with it.
Plant placement strategy
| Position | PAR | Plants |
|---|---|---|
| Foreground | 40–80 | Carpet plants |
| Midground | 30–60 | Stem plants, compact bushes |
| Shade areas | <30 | Epiphytes, mosses, Anubias |
Hardscape plays a major role here as well. Wood branches, large rocks, and overhangs create additional shadow beyond what the manufacturer chart shows. For broader structural layout planning, see the Aquarium Hardscape Guide.
PAR Charts vs Real Aquarium Conditions
Published PAR charts are useful, but they should never be treated as perfect representations of your own aquarium. Real tanks introduce many variables that alter light behavior.
Glass lids
Glass tops and covers reduce light penetration. Even clean glass lowers PAR somewhat, and dirty covers can reduce it more noticeably.
Floating plants
Floating species can dramatically cut PAR beneath the surface. This is helpful in some tanks, but it also means the published chart may overestimate the light available below the floating layer.
Hardscape shadows
Large pieces of driftwood and rock create localized shade that published charts do not account for. In nature-style or wood-heavy aquascapes, these shadows can completely change usable plant zones.
Tannins and water color
Dark water absorbs more light than crystal-clear water. In blackwater-inspired or biotope-style aquariums, real PAR at depth may be much lower than in a clean test tank.
This is another reason why published charts should be interpreted as guidance, not as absolute guarantees.
Common Mistakes When Reading PAR Charts
- Reading only the highest number instead of the full spread pattern
- Ignoring substrate PAR and focusing only on surface output
- Confusing spectrum graphics with PAR charts
- Assuming manufacturer conditions match real aquariums
- Believing more PAR is always better even when CO₂ and nutrients are unstable
These mistakes often lead to poor fixture choices, uneven plant growth, and algae problems. If your tank is already unstable, stronger light is rarely the first solution. In many cases, better maintenance, nutrient consistency, and regular water changes are more important. See the Aquarium Water Change Guide for system stability basics.
How to Measure PAR Yourself
If you want maximum accuracy, you can measure PAR directly in your own aquarium.
PAR meters
A true PAR meter is the best option for accurate readings. It allows you to test substrate zones, mid-water levels, and surface values directly in your aquarium.
Phone PAR apps
Smartphone apps are less precise, but they can still be useful for rough comparisons between fixtures or dimming settings. They are better for trend observation than for absolute measurements.
Measuring with a grid method
One practical approach is to divide the tank into a simple grid and measure PAR point by point. This gives you a personalized light map that reflects your real setup, including water clarity, mounting height, and hardscape shading.
PAR, CO₂ and Nutrients: The Balance Rule
PAR charts are powerful, but they only describe one part of the planted tank system. Light intensity always interacts with carbon availability and nutrient supply.
Higher PAR means higher plant demand. If CO₂ is unstable or fertilization is inconsistent, the system becomes vulnerable to algae. This is why experienced aquascapers never evaluate PAR in isolation. They evaluate it as part of the full growth triangle:
- Light
- CO₂
- Fertilization
If you want the broader system explanation, continue with the CO₂ System Guide and the Aquarium Plants Guide.
How to Use PAR Charts When Buying Aquarium Lights
PAR charts are especially useful when comparing lights before purchase. They help you look beyond marketing terms like “full spectrum” or “high output” and focus on real performance inside the tank.
Comparing two fixtures
When comparing two lights, do not just compare their maximum PAR values. Compare:
- substrate PAR
- edge coverage
- spread uniformity
- mounting assumptions
Spread vs intensity
A light with slightly lower peak PAR but better spread is often the better real-world choice for aquascaping. Balanced coverage is usually more valuable than a dramatic hotspot.
Choosing dimmable lights
Dimmable fixtures give you more flexibility. If a light is slightly too strong, dimming is usually easier than replacing the fixture entirely.
FAQ
What PAR is ideal at the substrate?
For many planted tanks, 30–60 PAR at the substrate is a practical working range. Low-light tanks can succeed below that, while demanding carpets and red plants often need more.
Is 100 PAR too much for aquarium plants?
Not necessarily, but it is considered high intensity. At that level, stable CO₂, fertilization, and maintenance become much more important.
Why is PAR lower at the edges of the aquarium?
Because light loses intensity as it spreads away from the center of the fixture. Many aquarium lights produce a hotspot in the middle and weaker values toward the glass.
Do floating plants reduce PAR?
Yes. Floating plants can significantly reduce the amount of usable light that reaches the lower parts of the aquarium.
How accurate are manufacturer PAR charts?
They are useful as comparison tools, but they are usually measured under ideal conditions. Real aquarium results may be lower because of water depth, glass lids, surface movement, and hardscape shadows.
Where should I measure PAR in a planted tank?
The most important measurement point is usually the substrate, because that determines how much usable light rooted plants receive.
Can I use a PAR chart to plan plant placement?
Yes. That is one of the most valuable uses of a PAR chart. It helps you match demanding plants to stronger zones and shade-tolerant plants to weaker areas.
Conclusion
Learning how to read aquarium PAR charts gives you a major advantage when building or upgrading a planted tank. Instead of guessing how strong a light might be, you can evaluate exactly where useful intensity exists and how evenly it is distributed.
The real value of a PAR chart is not the biggest number on the page. It is the pattern. Substrate PAR, edge drop-off, spread uniformity, and real-world losses all matter more than a single hotspot reading. Once you understand that, you can choose fixtures more intelligently and build plant layouts that actually fit your light map.
Used correctly, PAR charts turn aquarium lighting from guesswork into a more predictable system. And in aquascaping, predictability is what leads to healthier plants, fewer algae problems, and better long-term results.
Want to estimate your own light targets?
Use the Aquarium Lighting Calculator to compare PAR, Lux, and photoperiod targets for your planted tank.
New to AquariumLesson? Start with our complete Aquarium Lessons Hub or return to the homepage at AquariumLesson.com.